Show a list as a board, calendar or chart
Show a list as a board, a calendar with an hour grid, a timeline from start day to end day, a chart, or numbers in tiles above it.
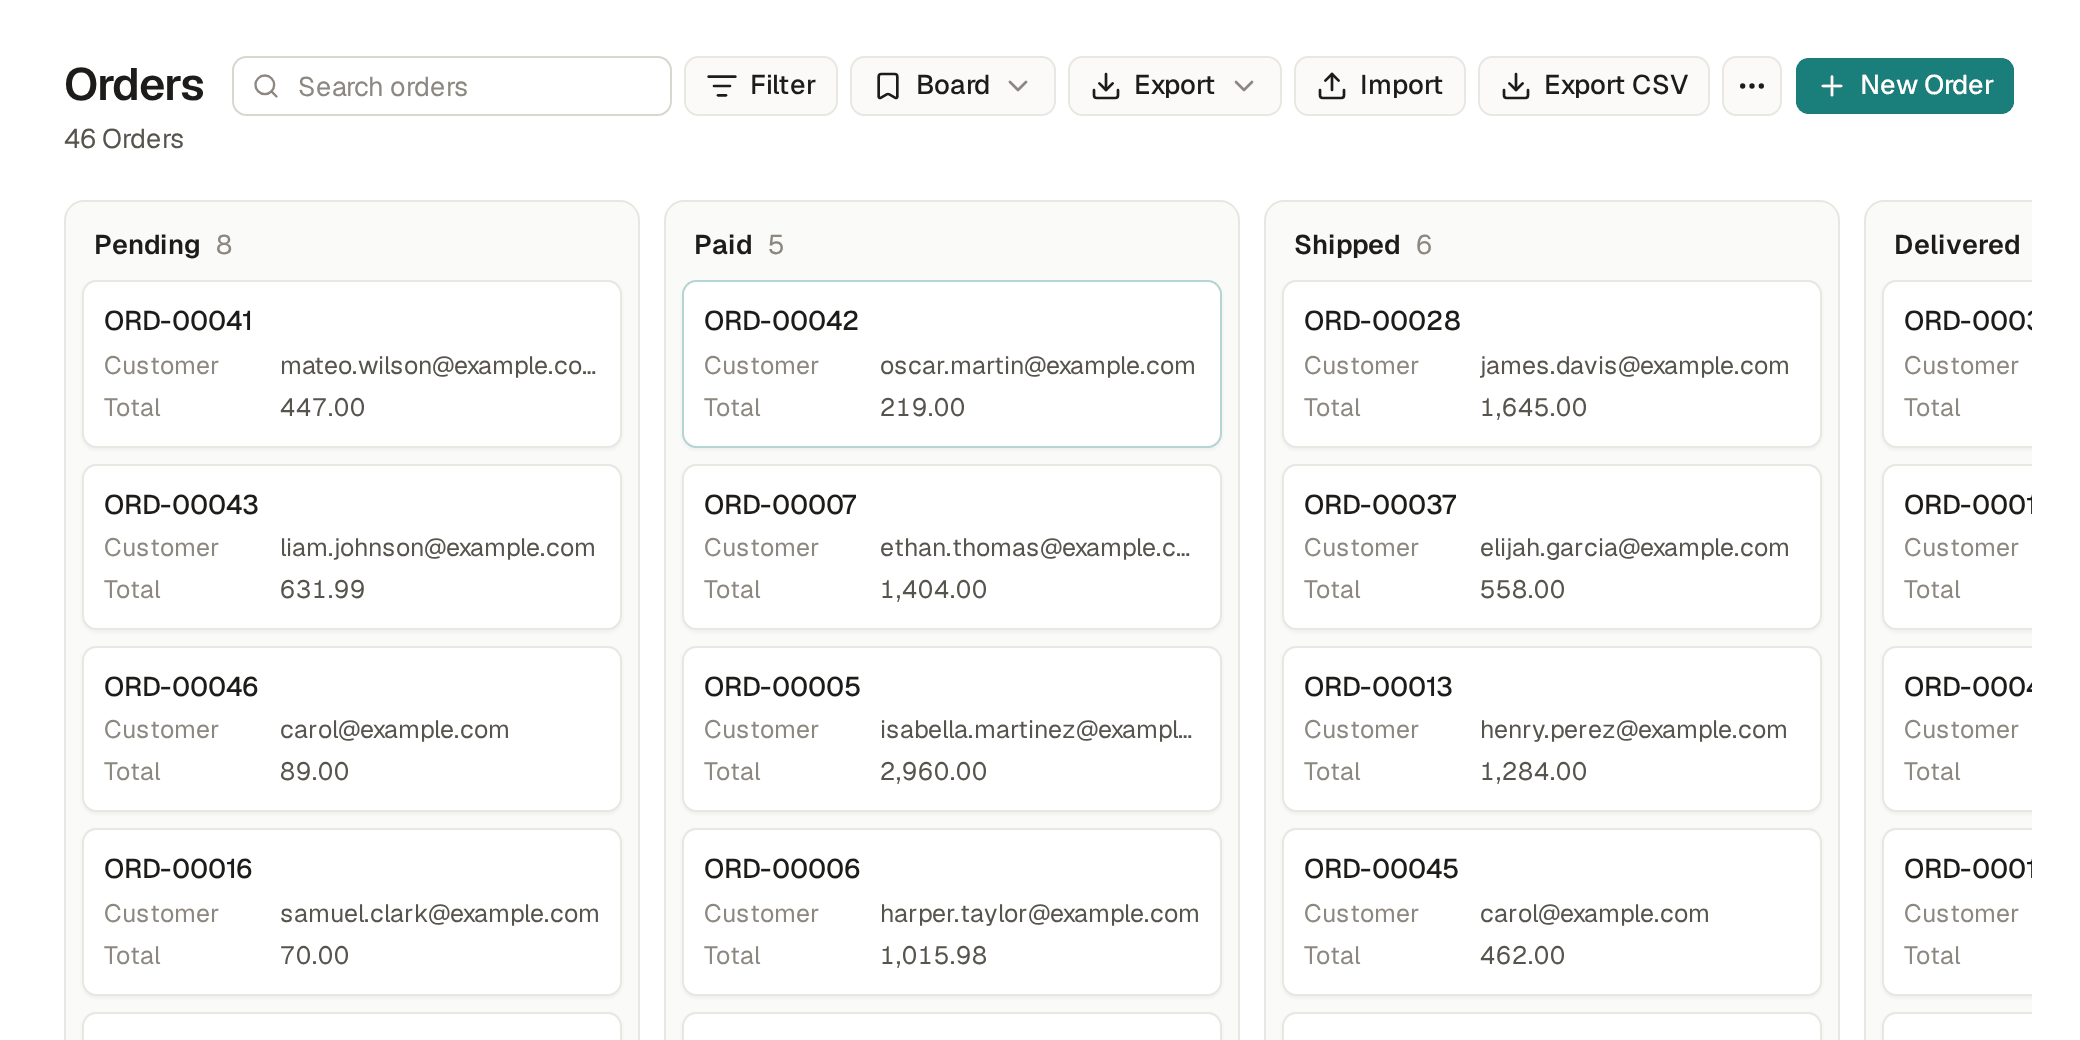
A board shows a list's items as cards, in a column for each choice of a field such as Status, and a calendar shows them on their date. You show a list as a board or a calendar from its Views menu.
- On a list, open the Views menu, beside Filter (Save a view of your own), and click Customize…
- Under Show as, pick Board and the field to Group by, such as Status, or Calendar and its Date. Click Apply.
- On a board, drag a card to another column to change its status; on a calendar, drag an item to another day to change its date.
- Save it from the Views menu to keep it. The shop's orders have a Board and a Calendar view ready, under Orders in the sidebar.
Show only some columns
A board shows a column for each choice of its field. To show only some, switch off Use all choices and tick the Choices that get a column, such as Pending and Paid, then click Apply. With none ticked, the board is refused with "Choose at least one choice". A view on the table's Views page in Builder has the same switch.
Keep cards in their column
A board can stop a card from moving to another column. In Customize…, under Show as with Board picked, switch on Cards stay in their column and click Apply. The switch is off by default. A card then does not drag to another column. If the table keeps a manual order and the board shows it, a card still drags to a new place in its own column; in any other order it does not drag. A view on the table's Views page in Builder has the same switch. The switch stops the drag only: a manager still changes the status in the item's form, and the assistant still changes it.
See what each column is worth
A board's column can show a total: pick a money or number field under Total, such as Total or Value, then click Apply. Each column's header then shows the sum of that field for its cards, beside their count. The sum counts only the cards you may see, with the view's filters and your search. If the cards are in several currencies, the column shows "Several currencies": filter the view on the currency. You can also ask the assistant, such as "Show the value of each stage on the pipeline." The Deals app's Pipeline board shows the value of the deals in each stage.
Limits and details
- If you may not change the item you drag, it goes back and a message says why.
- When the table keeps a manual order, a card also drops between two others, in its column or on its day (Drag items into the order you choose).
A calendar on a date and time field, such as an appointment's Starts at, shows a Month, a Week or a Day. Week and Day show the hours, so you see at once who is free at 14:00. A calendar on a date field shows only the month.
- On the calendar, click Month, Week or Day at the top. The arrows move by a month, a week or a day, and Today goes back to today. A view opens on the one it was saved with.
- Week has a column for each day, from your first day of the week (Set preferences, password and security). Day has one column. Each item is a block at its start time. The grid opens at the hour of the first item, or at 08:00, and marks today and the time now.
- To give each block its length, open the Views menu, click Customize… and, under Length, pick a field with the minutes, such as Duration, or a field with the end, such as Ends at. A block is as long as its minutes, or it goes until its end. When the view has no length, or an item has no minutes or no end, its block is one hour long.
- For a column for each person, pick a reference under Columns in the day view, such as Stylist. The Day then has a column for each stylist, in their order, and a column "No stylist" for the appointments that have none, when the field is not required. Week has no columns. Click Apply, and save the view from the Views menu to keep it.
- Drag a block to another hour to change its start: it moves in steps of 15 minutes. When the view has an end field, the end moves too, so the length stays the same. Drag a block to another column to change its stylist. Click a block to open the item.
Limits and details
- A drag is a change like any other. Only a user who may change the item can move it, and the base's limits apply (Stop double bookings and overselling with limits): when the stylist already has an appointment at that hour, the block goes back and a message says why, such as "This appointment overlaps APT-00012."
- On a phone, the grid moves sideways and a block does not drag: change the time on the item's page.
For the base's builders: a view on the table's Views page in Builder has the same Mode, Length and Columns in the day view, for everyone. You can also ask the assistant, such as "Show me tomorrow by stylist, hour by hour." In a base made from Hair salon team or Hair salon company, Appointments have a Day by stylist view, and in one made from Physiotherapy clinic team or company, Visits have a Day by therapist view; Hair salon and Physiotherapy clinic, for one person, have a Week view instead.
A timeline shows each item as a bar from its start day to its end day, so you see at once what runs at the same time and who has too much to do. A timeline needs two date or date and time fields, such as a task's Starts on and Due on.
- On a list, open the Views menu, beside Filter (Save a view of your own), and click Customize…
- Under Show as, pick Timeline. Under Start, pick the field where each item starts, and under End the field where it ends. For a line for each person, project or status, pick a reference, such as Assignee, or a choice, such as Status, under Lines. Under Scale, pick whether it opens on weeks or on months. Click Apply.
- Each item is a bar from its start day to its end day, on the line of its value. The items with no value are on a line of their own, such as "No assignee". An item with no start is a point on its end day. An item with no end does not show. Point at a bar to see the view's columns, under the item's name.
- Click Weeks for four weeks, with a column for each day, or Months for six months, with a column for each week. The arrows move back or forward in time, and Today goes back to today.
- Drag a bar to move it: its start and its end move by the same number of days. Drag the end of a bar to change only its end day. Click a bar to open the item.
- Save it from the Views menu to keep it.
A drag is a change like any other. Only a user who may change the item and its dates can drag its bar. When someone else changes an item, its bar moves at once, with no reload.
Show a related list as a timeline on an item's page
An item's page can show a related list as a timeline too, such as a project's stages on the project's page (Open an item’s page: comments, history, Follow and Duplicate). The list keeps its title, its count, View all and New, and shows only the items that point at this one. Weeks, Months, the arrows and Today work as on a timeline view and stay on the page, and a drag moves the item's days in the same way. A user who may not read the start or the end sees the list's rows.
For a related list as a timeline, open the reference field's box in Builder, such as a stage's Project, and turn on Show as a timeline (Show the items that point at an item on its page). Pick Start, End, Lines and Scale from the fields of the table that holds the reference, as for a view. You can also ask the assistant, such as "Show each project's stages on a timeline on the project's page."
A timeline for everyone
For the base's builders: a view on the table's Views page in Builder has the same choices, for everyone. You can also ask the assistant, such as "Show the tasks on a timeline, a line for each person." In the Tasks app, a task has the date Starts on, and Tasks has a Timeline view, with a line for each assignee. In Projects, a stage has the date Starts on, Stages has a Schedule view, with a line for each project, and a project's page shows its stages on a timeline.
Through the API, a timeline view is a view of the type timeline, with its start in field,
its end in end and its lines in by. A related list as a timeline is the reference field's related_timeline, with the same field, end, by and mode as a timeline view.
A chart shows how a list adds up: a bar or a point for each group, with how many items it holds, the sum of a number or its average.
- On a list, open the Views menu, beside Filter (Save a view of your own), and click Customize…
- Under Show as, pick Chart. Draw as: Bars or A line. Value: how many items, such as Number of orders, or the sum of a number field, such as Sum of Total, or its average, such as Average of Total. Group by: a choice such as Status, a reference such as Customer, a yes / no, a text or a whole number, such as a shift's Week, or a date by day, week, month or quarter, such as Placed at, by month. Click Apply.
- Save it from the Views menu to keep it: the view opens as that chart again.
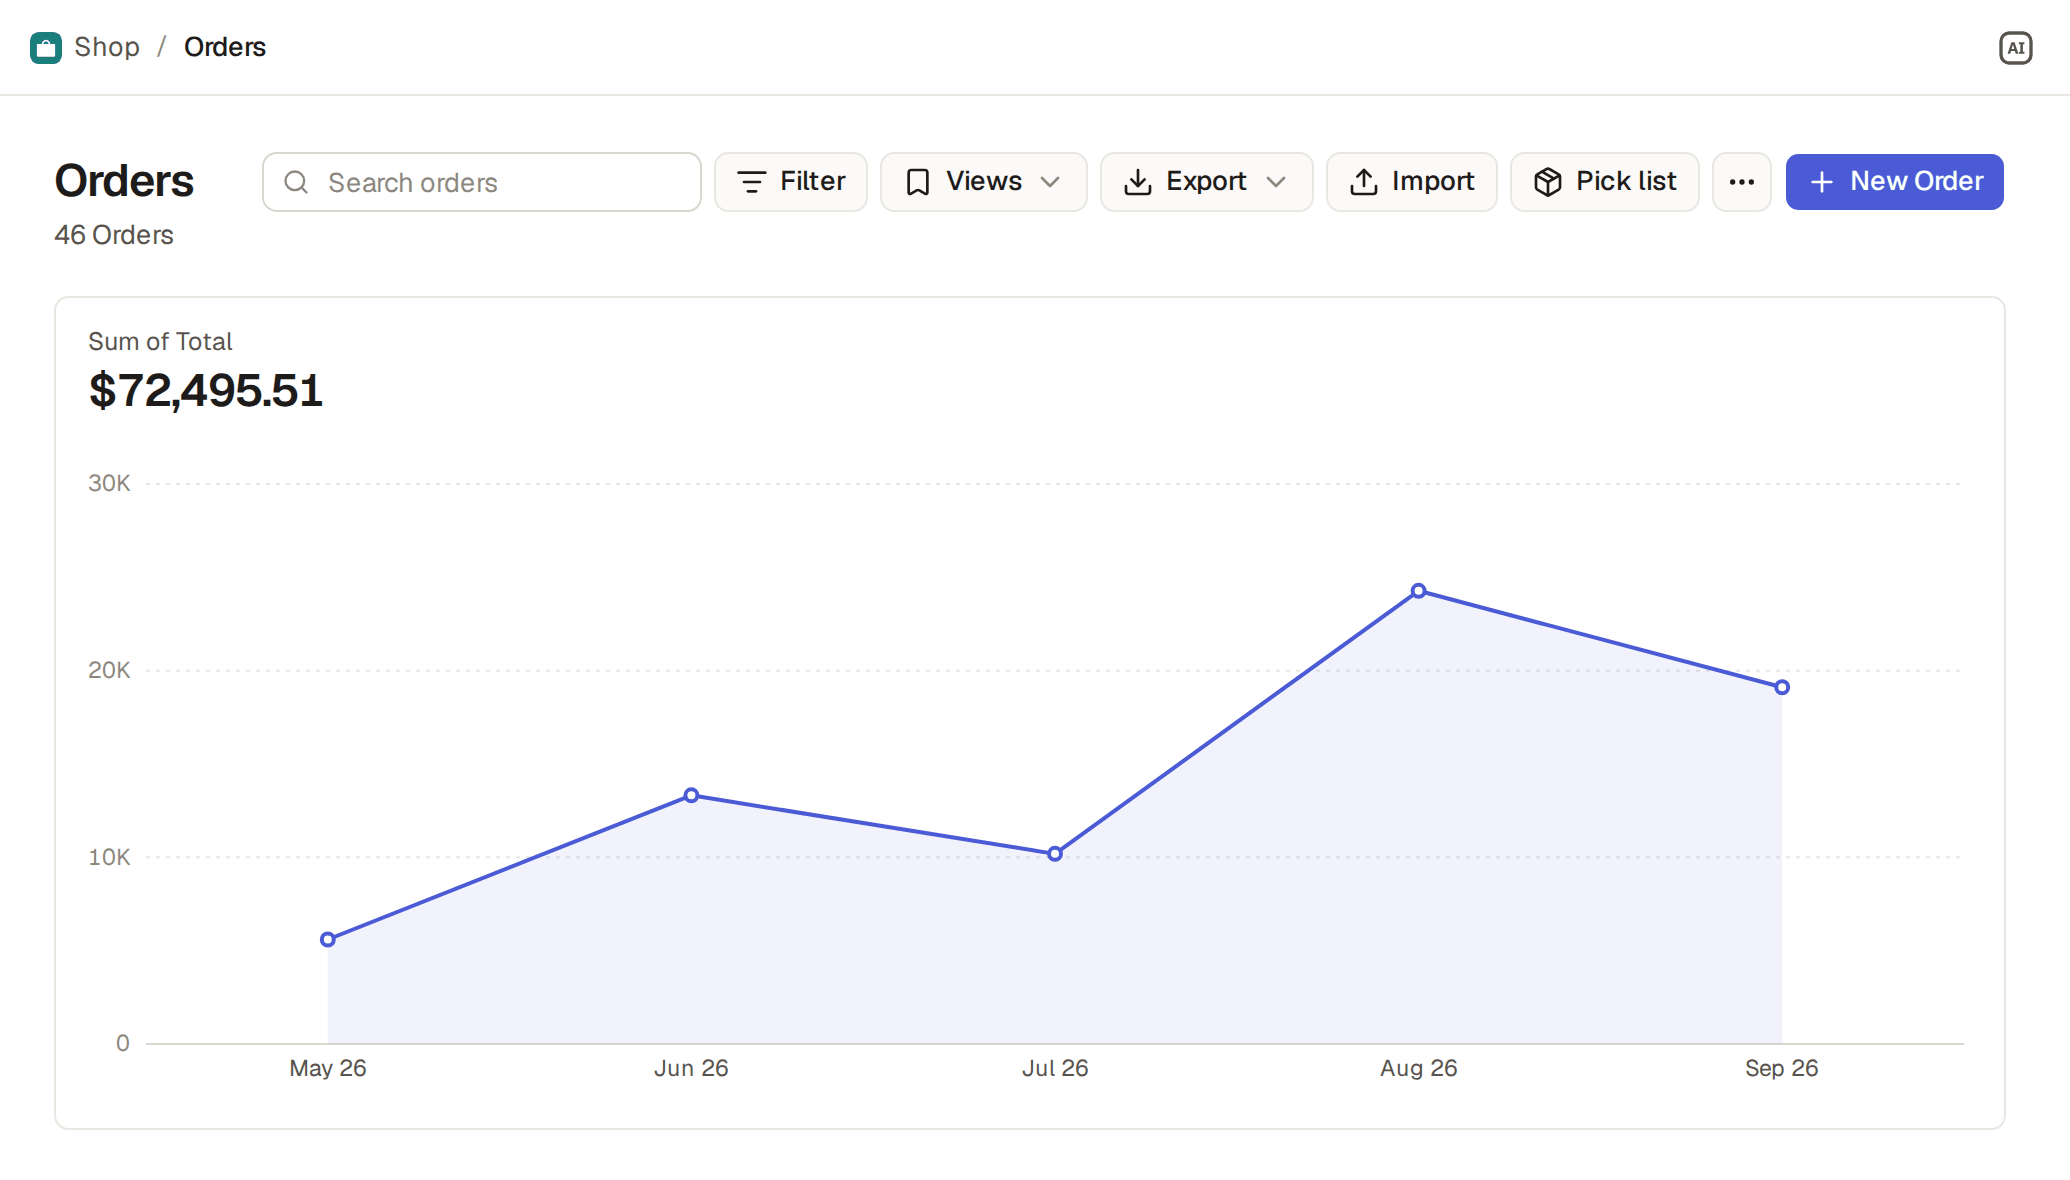
Above the chart, what it measures and its total over the whole list. Point at a bar or a point, or reach it with the Tab key, to read its value. Choices come in the order of their options, references by name, and days, weeks, months and quarters in order, a month with nothing in it at 0; the items with the field empty make the last group, such as "No Sales rep".
Limits and details
- The chart follows the list's filters and search, and counts only what you may see: the chart of orders of a user with only the sales role counts their own orders.
- A table with no field to group by offers only a number (Show counts and totals above a list).
For everyone, the table's Views page in Builder makes the same chart (Make a view for everyone), and Show on the dashboard puts it there. The shop's orders have Orders per month, bars on the Dashboard, and Revenue per month, a line, under Orders in the sidebar. You can also ask the assistant: "Show me orders per month" makes a chart, "Show me the average order value per month" makes one with Average of Total, while "How many orders this month?" gets its answer in words.
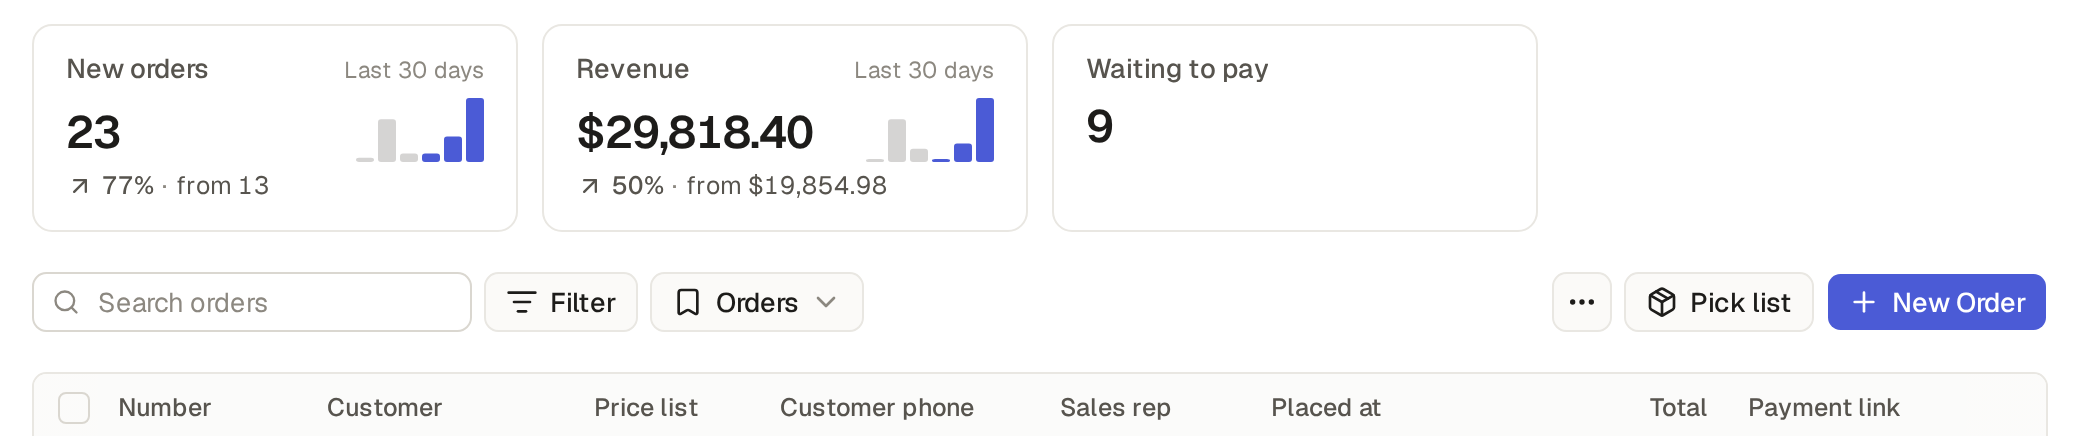
A number view is a chart that shows one number, as a tile above its table's list: how many items, the sum of a number field or its average. The shop's Orders list starts with three: New orders, Revenue and Waiting to pay.
- On a list, open the Views menu, beside Filter (Save a view of your own), and click Customize…
- Under Show as, pick Chart, and under Draw as, pick A number. Value: how many items, such as Number of orders, or the sum of a number field, such as Sum of Total, or its average, such as Average of Total. A number has no Group by: in its place, Date offers the table's date and date and time fields. Pick one, such as Placed at, to see the number of the last 30 days and its change, or keep None for the number now. Add the filters you need, such as Status is Pending, and click Apply: the list shows the tile, large.
- Save it from the Views menu to keep it: its tile then shows above the list.
What a tile shows
A tile shows the view's name and its number. With a date field, it reads Last 30 days: the number is that of today and the 29 days before it, in the base's time zone. Under the number are the change against the 30 days before, as an arrow and a percent, and the number it changed from, such as "↗ 77% · from 13". Beside them, six small bars show the last 60 days, ten days each; the last three, the 30 days the number counts, are marked.
- The arrow and the percent are grey, not green or red: the base does not know whether more is better, and more customers lost is worse.
- When the 30 days before hold nothing, the tile shows no arrow and no percent, but "0 in the 30 days before".
- With no date field, the tile shows the number now, with no change and no bars, such as the orders Waiting to pay.
- A sum of amounts in several currencies reads "Several currencies" in place of its number, with no change and no bars (Show amounts in a currency).
- Click a tile to open the table's list under the tile's filters, and the last 30 days when it has a date field: the list then holds what the number counts.
Choose the tiles of a view
Each view chooses the tiles above its list. In the list, open the Views menu, click Customize current view… and open the Tiles tab. In Tiles above the list, choose one of these:
- Automatic: every number view of the table that you may see, the base's first, then yours, at most 8. Every view starts so.
- None: no tiles above this view's list.
- These: only the tiles in the list under it, in that order, at most 8.
To change the list, click the × of a tile to remove it, Add tile to add one of the table's number views or New tile… to make one (its name, its value, its date field and its filters, as above), the pencil to edit one, and drag a tile by its handle to move it. A change on Automatic or None makes the view These. Click Apply: the tiles change at once, the address keeps them, and the sidebar shows Custom view until you save it with Save view. When you save, a new or edited tile becomes a number view of your own; a number view of the base is never changed from here: an edited one is saved as your own copy.
Count only this view's items, off by default, makes each tile count only the items of the view's filters too: on a view of your orders, Revenue is your revenue. It never follows the search box.
In Builder, the table's Views page has the same Tiles setting for the base's views, from the base's number views only.
Limits and details
- A view shows at most 8 tiles: a 9th is refused with "A view shows at most 8 tiles". A tile you may not see is left out and does not count.
- A table has at most 12 of the base's number views and 8 of each user's own: one more is refused with "A table has at most 12 number views of the base" or "You have 8 number views on this table already".
- When a number view is deleted, it goes from every view's tiles.
- On a phone, the tiles are one row that you scroll sideways, and the list starts under it.
- Without Count only this view's items, the tiles do not follow the list's search and filters. Each user sees the numbers of what they may see: the New orders of a user with only the sales role counts their own orders only.
- A number view is not in the sidebar, and it is never a table's default view, since it holds no items to work on. The Views menu lists it: open it there to see its tile, large, and to change it.
For everyone, the table's Views page in Builder makes the same number (Make a view for everyone), with no Default switch, and Show on the dashboard puts its tile on the Dashboard, as the shop's New orders. The shop also has Low on stock above Products and To be paid above Invoices, and Jane, a manager, has a number view of her own, My new orders, after the base's three above Orders. You can also ask the assistant: "Put a tile with the revenue of the last 30 days above Orders" makes a number view, "Show only Revenue above the orders list in the Packing view" sets that view's tiles, and "How many orders this month?" gets its answer in words.